
Test accuracy of my best classification model: 97.796%
Successful predictions of chair:
|
|
|
|
|

|

|
|
Successful predictions of vase:
|
|
|
|
|

|

|
|
Successful predictions of lamp:

|
|

|
|

|

|

|
|
Failed prediction examples:
|
|
|
|
|

|
|
|
|
|

|

|
Confusion Matrix:
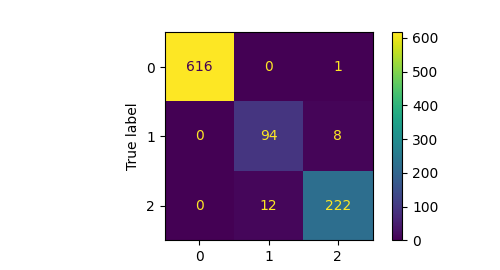
Interpretation:
The classification for these three classes, namely chair (label 0), vase (label 1) and lamp (label 2), yielded pretty good results.
From the confusion matrix it is evident tha the classification model sometimes make wrong predictions between vases and lamps. On the other hand the model predicts chair almost perfectly.
This could be due to the fact that lamps and vases have somewhat similar geometry, and it is sometimes hard to differentiate even for humans without any texture information. Chairs, on the other hand, have very different structure as compared to vases and lamps.
Another reason is the unbalanced testing/training dataset. The chair class is much larger than the other two classes. There are 4489 chairs, 741 vases and 1554 lamps in the test data and the learned model is tested on 617 chairs, 102 vases, and 234 lamps. This data unbalance also affects our results.
Test accuracy of my best segmentation model: 90.171%
Top 5 successful predictions with corresponding ground truth:
Test accuracy of object: 99.67%
pred
|
gt
|
Test accuracy of object: 99.62%
pred
|
gt
|
Test accuracy of object: 99.35%
pred
|
gt

|
Test accuracy of object: 99.33%
pred
|
gt
|
Test accuracy of object: 99.33%
pred
|
gt

|
Top 5 bad predictions with corresponding ground truth:
Test accuracy of object: 43.04%
pred
|
gt

|
Test accuracy of object: 48.54%
pred
|
gt

|
Test accuracy of object: 51.39%
pred

|
gt

|
Test accuracy of object: 51.41%
pred
|
gt
|
Test accuracy of object: 52.73%
pred
|
gt
|
Interpretation:
Since we are sampling 10000 points randomly, which is not a lot, and the segmetation model is making the part segmentation predictions based on them, some of the chairs which need more points to have a denser reprentation are being poorly segmented as we can see from the above examples.
| Number of points | Classification test accuracy | Segmentation test accuracy |
|---|---|---|
| 10000 | 97.796% | 90.171% |
| 1000 | 97.377% | 89.892% |
| 100 | 93.494% | 83.240% |
| 10 | 28.226% | 67.812% |
| 1 | 24.554% | 55.105% |
Clearly, with less number of points per object the test accuracy drops, both in classification and in segmentation task.
10000 pts

|
1000 pts
|
100 pts
|
10 pts
|
1 pt

|
10000 pts
|
1000 pts
|
100 pts

|
10 pts
|
1 pt
|
10000 pts

|
1000 pts
|
100 pts
|
10 pts
|
1 pt
|
gt:10000 pts
|
gt:1000 pts

|
gt:100 pts
|
gt:10 pts
|
gt:1 pt

|
99.35% part seg accuracy
pred:10000 pts
|
99.20% part seg accuracy
pred:1000 pts
|
97.00% part seg accuracy
pred:100 pts

|
100.00% part seg accuracy
pred:10 pts

|
100.00% part seg accuracy
pred:1 pt
|
Code:
relative_rotation = pytorch3d.transforms.euler_angles_to_matrix(torch.tensor([0, 0, rotz_rad]), "XYZ")
test_data[:,]= test_data[:,] @ relative_rotation
| Rotation about Z (degrees) | Classification test accuracy | Segmentation test accuracy |
|---|---|---|
| 0 | 97.796% | 90.171% |
| 30 | 62.434% | 71.794% |
| 60 | 32.109% | 55.076% |
| 90 | 20.76% | 38.233% |
Clearly, with more degrees of rotation, the test accuracy falls, both in classification and in segmentation task.
$\theta_Z$ = 0

|
$\theta_Z$ = 30
|
$\theta_Z$ = 60
|
$\theta_Z$ = 90
|
$\theta_Z$ = 0

|
$\theta_Z$ = 30
|
$\theta_Z$ = 60

|
$\theta_Z$ = 90
|
$\theta_Z$ = 0

|
$\theta_Z$ = 30
|
$\theta_Z$ = 60

|
$\theta_Z$ = 90
|
Visualisation for segmentation:
gt: $\theta_Z$ = 0
|
gt: $\theta_Z$ = 30

|
gt: $\theta_Z$ = 60

|
gt: $\theta_Z$ = 90

|
|
pred: $\theta_Z$ = 0 99.35% part seg accuracy 
|
pred: $\theta_Z$ = 30 83.95% part seg accuracy 
|
pred: $\theta_Z$ = 60 63.15% part seg accuracy 
|
pred: $\theta_Z$ = 90 44.64% part seg accuracy 
|
Code:
torch.normal(mean=0, std = sigma * torch.ones_like(test_data))
| $\sigma$ (standard deviation of zero-mean Gaussian Noise) | Classification test accuracy | Segmentation test accuracy |
|---|---|---|
| 0.00 | 97.796% | 90.171% |
| 0.01 | 97.271% | 89.917% |
| 0.05 | 89.612% | 83.147% |
| 0.10 | 83.631% | 64.766% |
| 0.50 | 64.743% | 46.299% |
| 1.00 | 64.743% | 42.223% |
| 5.00 | 64.743% | 37.083% |
| 100.00 | 64.743% | 35.670% |
Clearly, as expecetded with higher standared deviation, the test accuracy drops, both in classification and in segmentation task. Suprisingly, the test accuracy stops reducing on further adding noise beyond a certain point (stays at 64.743%).
Visualisation for classification - example 1:
$\sigma$ = 0.00
|
$\sigma$ = 0.01
|
$\sigma$ = 0.05
|
$\sigma$ = 0.10

|
$\sigma$ = 0.50
|
$\sigma$ = 1.00

|
$\sigma$ = 5.00
|
$\sigma$ = 100.00

|
Visualisation for classification - example 2:
$\sigma$ = 0.00

|
$\sigma$ = 0.01

|
$\sigma$ = 0.05

|
$\sigma$ = 0.10
|
$\sigma$ = 0.50
|
$\sigma$ = 1.00

|
$\sigma$ = 5.00
|
$\sigma$ = 100.00

|
Visualisation for classification - example 3:
$\sigma$ = 0.00

|
$\sigma$ = 0.01
|
$\sigma$ = 0.05
|
$\sigma$ = 0.10
|
$\sigma$ = 0.50

|
$\sigma$ = 1.00

|
$\sigma$ = 5.00
|
$\sigma$ = 100.00
|
Visualisation for segmentation:
gt: $\sigma$ = 0.00
|
gt: $\sigma$ = 0.01
|
gt: $\sigma$ = 0.05
|
gt: $\sigma$ = 0.10
|
|
pred: $\sigma$ = 0.00 99.35% part seg accuracy 
|
pred: $\sigma$ = 0.01 99.12% part seg accuracy 
|
pred: $\sigma$ = 0.05 91.92% part seg accuracy 
|
pred: $\sigma$ = 0.10 82.09% part seg accuracy 
|
gt: $\sigma$ = 0.50
|
gt: $\sigma$ = 1.00
|
gt: $\sigma$ = 5.00

|
gt: $\sigma$ = 100.00
|
|
pred: $\sigma$ = 0.50 56.03% part seg accuracy 
|
pred: $\sigma$ = 1.00 48.74% part seg accuracy 
|
pred: $\sigma$ = 5.00 43.96% part seg accuracy 
|
pred: $\sigma$ = 100.00 42.27% part seg accuracy 
|
Point Net ++
Implemented PointNet++ architecture for classification to incorporate locality in the vanilla PointNet architecture.
The PointNet++ architecture has the following components:
The network is then trained using CrossEntropyLoss.
Test accuracy of my best classification model for PointNet was: 97.796%
Test accuracy of my best classification model for PointNet++ is: 98.306%
Visualisation:
|
PointNet
|
PointNet ++

|
|
PointNet
|
PointNet ++
|
Interpretation:
We observe that Pointnet++ performs slighly better than Pointnet.